
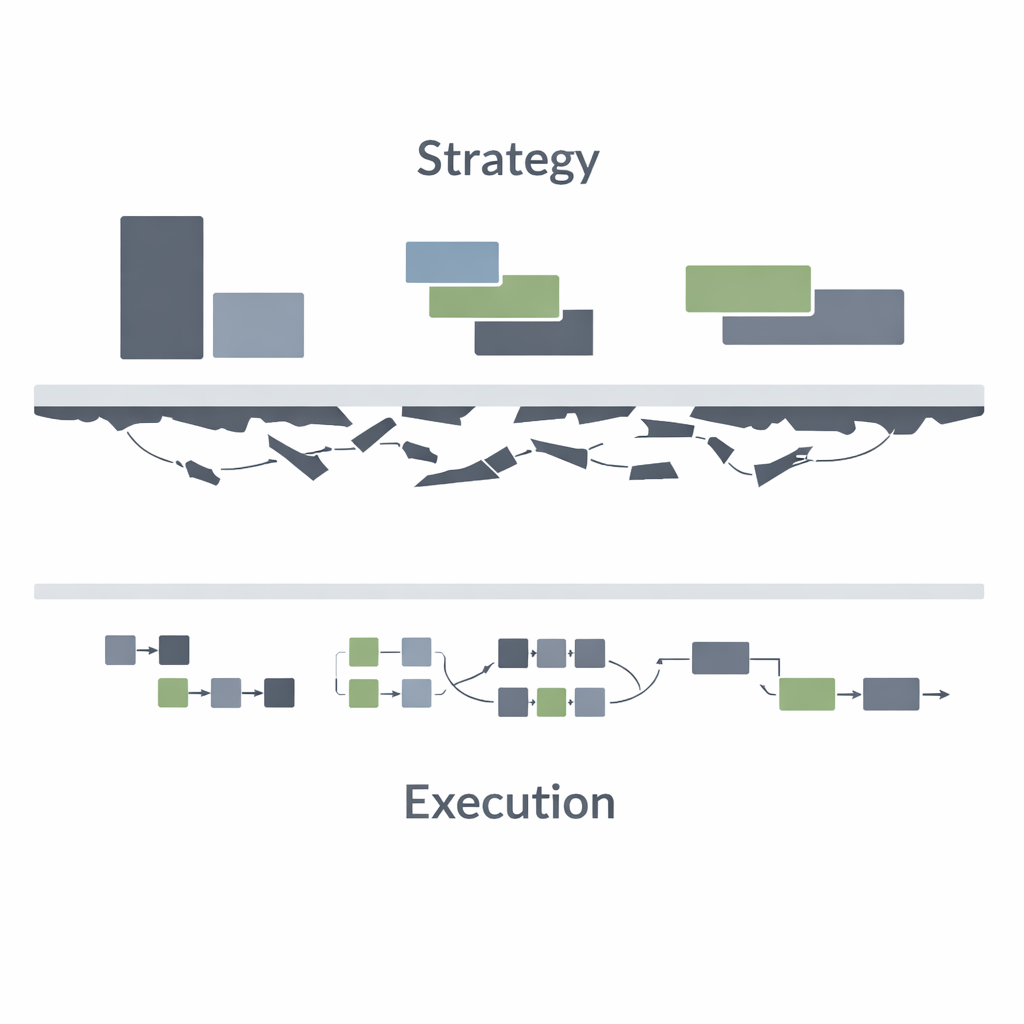
This page provides definitions of terms you may come across when exploring the topic of Strategic Flow. It’s important to have a clear understanding of these terms when navigating the gap between strategic intent and strategic execution. Understanding what each of these terms means will equip you to make decisions about where your organisation lies in the strategy-execution gap and what steps you can take to bridge, or better yet, close, that gap. This glossary covers foundational concepts from Wardley Mapping, the Kanban Maturity Model, and OKRs to provide a unified language for organisational flow.
What is Strategic Flow
Definition: Strategic Flow is the systematic synchronisation of high-level strategy intent with team-level execution. It is a management discipline that ensures value moves through an organisation without friction by aligning competitive positioning (Wardley Mapping), goal-setting (OKRs), and workflow management (Kanban).
- Origin: Developed by Toby Corballis at Strategic Flow to bridge the “Strategy-Execution Gap” found in traditional corporate structures.
- Key Indicator: High Flow Efficiency (minimal time spent in “waiting” states) and a 1:1 correlation between daily tasks and strategic objectives.
- Strategic Impact: Eliminates “Strategy Rot” where high-level plans fail to materialise. Organisations achieving Strategic Flow can pivot 3x faster than competitors because their execution engine is natively wired to their strategy engine.
- See also: the About page
Agile
Definition: Agile is an iterative approach to project management and software development that helps teams deliver value to their customers faster and with fewer headaches. Instead of a “big bang” launch, agile teams deliver work in small,consumable increments.
- Origin: Formally codified in the Manifesto for Agile Software Development (2001) by 17 technologists in Utah.
- Key Indicator: Short feedback loops (Sprints/Cycles) and the regular delivery of “working software” or tangible value.
- Strategic Impact: Increases organisational adaptability.
AI Readiness
Definition: An assessment of an organisation’s data, processes, and skills to effectively adopt and integrate AI. This is a crucial piece to understand. Many AI initiatives fail because either the organisation isn’t ready for AI in the area into which it is being introduced – meaning more foundational work is required – or because of overreach. An additional factor to understand is where organisational bottlenecks are – making something 30x faster ahead of a bottleneck will overwhelm the bottleneck without providing any real benefit.
AI Velocity Illusion
Definition: The illusion that simply adding more AI tools to an organisation will make the organisation faster, more nimble, and mean that costs can be saved elsewhere.
- Origin: Coined by Toby Corballis in his February 2026 research paper The AI Velocity Illusion.
- Key Indicator: Implementing AI initiatives with no cohesive outline of what each is intended for, its benefits, and the realised value they will bring.
- Strategic Impact: Increases organisational overload leading to multiple failures and a perception that AI is no good. In all likelihood, the overload was the problem, not the tooling.
Balanced Scorecard (BSC)
Definition: The BSC is a strategic performance management framework that tracks operational activities against a “balanced” set of four perspectives: Financial, Customer, Internal Process, and Learning/Growth.
- Origin: Developed by Dr. Robert Kaplan and Dr. David Norton (1992).
- Key Indicator: A one-page report showing a mix of financial and non-financial data points.
- Strategic Impact: Prevents a narrow focus on short-term profits by forcing leaders to invest in the processes and people that drive long-term value.
Bottlenecks
Definition: See Theory of Constraints, below.
Business Model Canvas (BMC)
Definition: The BMC is a strategic management template for developing new or documenting existing business models. It visualises the nine building blocks of a company’s value proposition, infrastructure, and customers.
- Origin: Developed by Alexander Osterwalder.
- Key Indicator: A single-page canvas featuring blocks like “Key Partnerships,” “Revenue Streams,” and “Customer Segments.”
- Strategic Impact: De-risks new ventures by forcing entrepreneurs to prove how all parts of the business model fit together before spending capital.
Cascading OKRs
Definition: The process of aligning OKRs from the company level down to teams and individuals, ensuring everyone works toward the same top-level goals.
Cognitive Load
Definition: The amount of mental effort required to complete a task. High cognitive load on teams (due to poor processes or unclear goals) kills flow and predictability, directly reducing the value delivered to the organisation (often to the tune of millions, even hundreds of millions).
Constitutional AI
Definition: AI that is built to be helpful, harmless, and honest. Constitutional AI platforms have a number of inbuilt guardrails such as principles designed to avoid toxic or discriminatory outputs.
Cost of Delay
Definition: The amount of money lost by delaying the date by when a customer is able to pay to use a product, service, or feature. Usually measure cost per week.
- Origin: Developed by Don Reinertsen in 1983.
- Key Indicator: Multiple initiatives landing (or none) for which no measurable value can be tracked, whilst (assumed) high-ticket products, services, and features languish in queues awaiting development.
- Strategic Impact: Enables economic prioritisation of work. Over time, it grows institutional disciple and leads to far higher ROI.
Customer Value Proposition (CVP)
Definition: A CVP is a clear statement that explains how your product solves customers’ problems, delivers specific benefits, and tells the ideal customer why they should buy from you and not from the competition.
- Origin: Strategic marketing theory (widely used in BMC).
- Key Indicator: A concise “Product-Market Fit” statement (e.g., “Our [Product] helps [Segment] who want to [Job] by [Reducing Pain/Increasing Gain]”).
- Strategic Impact: Acts as the “North Star” for all product development and marketing messaging.
F4P Metrics
Definition: F4P metrics – part of the Fit-for-Purpose framework– are a balanced portfolio consisting of Outcome Metrics (did the customer achieve their goal?), Fitness Criteria (did we meet their threshold?), and Health Indicators.
- Origin: Anderson and Zheglov’s Fit for Purpose.
- Key Indicator: Measurement of the “Fitness Gap” between what the customer needs and what the service provides.
- Strategic Impact: Realigns the entire organisation around the customer’s definition of “Good,” rather than internal perceptions of quality.
Failure Demand
Strategic Flow define Failure Demand as demand placed on a system caused by a failure to do something, or do something right, for a customer. It represents systemic “waste” where resources are consumed correcting errors or chasing status updates rather than creating new value.
- Origin: Originally defined by British psychologist John Seddon (Vanguard Method) in the context of service organisations.
- Key Indicator: A high volume of “Where is my order?” calls or “Rework” tickets in a backlog.
- Strategic Impact: Often accounts for 40% to 80% of operational costs in large enterprises; removing it is the fastest way to increase capacity without hiring.
Fit-for-Purpose (F4P) Framework
Definition: The F4P framework is a strategic management tool used to understand why customers choose a product or service. It focuses on aligning a business’s “purpose” with the customer’s “needs.”
- Origin: Developed by David J. Anderson and Alexei Zheglov.
- Key Indicator: The F4P Card, where customers score a service based on their specific intent/purpose.
- Strategic Impact: Moves businesses away from “averaging” customer satisfaction and toward meeting the specific requirements of the most profitable segments. Helps highlight segments that are underperforming or not profitable.
- See also: F4P Metrics, Health Metrics, Improvement Drivers, and Vanity Metrics.
Flow
Strategic Flow defines Flow as the continuous, smooth movement of value through a system. In knowledge work, it is the state where work moves from concept to customer with minimal waiting or waste.
- Origin: Rooted in Lean Manufacturing; translated to knowledge work through The Flow Framework (Mik Kersten) and Kanban.
- Key Indicator: Low Cycle Time and high Flow Efficiency (the ratio of active work time to total time).
- Strategic Impact: A high-flow organisation can out-experiment and out-deliver competitors by shrinking the time between an idea and its validation.
Health Metrics (F4P Context)
Definition: Health metrics (or “Keep-the-Lights-On” metrics) measure the vital signs of a process to ensure it remains stable. They are not improvement goals themselves, but rather boundaries.
- Origin: Rooted in Statistical Process Control (SPC) and adapted by the F4P framework.
- Key Indicator: Metrics that stay within a “normal” range (e.g., Employee Turnover, Server Uptime).
- Strategic Impact: Prevents “metric gaming” by ensuring that pursuing an improvement driver doesn’t inadvertently damage the business’s foundation.
Human-in-the-Loop (HITL)
Definition: A model where AI systems require human intervention or validation, crucial for strategy and oversight. This is often mandated in regulation and can represent a bottleneck ahead of which serious consideration on how to implement / apply AI needs to be given.
Improvement Drivers (F4P Context)
Strategic Flow defines improvement drivers as metrics specifically chosen to guide the organisation toward a new level of performance. Unlike health metrics, these are intended to change.
- Origin: Part of the Fit-for-Purpose metrics portfolio.
- Key Indicator: Metrics directly tied to a strategic “Objective” (e.g., reducing Lead Time from 20 days to 10 days).
- Strategic Impact: Provides the “thrust” for organisational change, focusing resources on the most important competitive gaps.
Jobs to be Done (JTBD)
Definition: JTBD is a framework for understanding customer behaviour. It posits that customers don’t buy products; they “hire” them to help them make progress in a specific circumstance (a “job”).
- Origin: Pioneered by Tony Ulwick and Clayton Christensen.
- Key Indicator: The “Job Story”: “When I am [Situation], I want to [Motivation], so that I can [Outcome].”
- Strategic Impact: Focuses innovation on the problem rather than the solution, protecting businesses from being disrupted by newer technologies that do the same “job” better.
Kanban
Definition: Kanban is a lean workflow management method for defining, managing, and improving services that deliver knowledge work. It focuses on visualising work, limiting Work in Progress (WIP), and enhancing flow.
- Origin: Originally derived from the Toyota Production System (Taiichi Ohno); adapted for knowledge work by David J. Anderson in the early 2000s.
- Key Indicator: The use of a visual board (Kanban Board) and explicit WIP limits to prevent system overburdening.
- Strategic Impact: Shifts the focus from “starting” work to “finishing” work, drastically reducing lead times and improving delivery predictability.
Kanban Maturity Model (KMM)
Definition: The KMM is a roadmap designed to help organisations implement the Kanban Method effectively. It maps 150+ specific practices across seven maturity levels (0 to 6) to align agility with business strategy.
- Origin: Developed by David J. Anderson and Teodora Bozheva.
- Key Indicator: Progressing from “Individual/Team-focused” (Level 1) to “Fit-for-Purpose” (Level 3) and eventually “Antifragile/Built for Survival” (Level 6).
- Strategic Impact: Prevents “Agile failure” by ensuring that the level of practice is appropriate for the organisation’s current culture and complexity.
Key Performance Indicators (KPIs)
Definition: KPIs are critical (key) indicators of progress toward an intended result. They provide a focus for strategic and operational improvement and create an analytical basis for decision-making.
- Origin: Evolution of Peter Drucker’s “Management by Objectives” (1950s).
- Key Indicator: A metric that is directly linked to a top-level business outcome (e.g., Gross Margin, Customer Lifetime Value).
- Strategic Impact: Acts as the “instrument panel” for the business, alerting leadership to health issues before they become catastrophic failures.
Lean Portfolio Management (LPM)
Definition: LPM is the application of Lean and Systems Thinking to the modernisation of strategy, funding, and operations. It replaces traditional annual planning with a more dynamic, “continuous” funding model.
- Origin: Part of the Scaled Agile Framework (SAFe) and Lean movement.
- Key Indicator: Shifting from “Project Funding” (fixed scope/time) to “Value Stream Funding” (funding long-lived teams).
- Strategic Impact: Increases organisational agility by allowing leadership to reallocate funds to winning initiatives in real-time, rather than being locked into a 12-month budget cycle.
Martec’s Law
Definition: Martec’s Law posits that the rate of technology change is exponential whilst the rate of organisational change is logarithmic. This creates a gap between them which is ever-widening and can never be closed. The choice for leadership is, therefore, not how to close the gap, but how to manage it in a controlled, safe, and meaningful way that enable the organisation to win in its adopted market.
- Origin: Introduced by Scott Brinker in 2013, the name derives from his observations regarding technology in the Marketing sector; however, our experience is that it applies to all sectors.
- Key Indicator: Noticing that technology uptake appears stalled inside your organisation or that your competitors always seem to be one step ahead (they’re often not).
- Strategic Impact: Understanding Martec’s Law helps leaders become better equipped for decision making with respect to the technology choices being made. It is especially powerful when coupled with tools such as Wardley Mapping and OKRs.
OKRs (Objectives and Key Results)
Definition: OKRs are a collaborative goal-setting framework used by teams and individuals to set ambitious, measurable goals with trackable outcomes, and to focus attention on the most valuable parts of the organisation’s current strategy.
- Origin: Developed by Andy Grove at Intel and later popularised at Google by John Doerr.
- Key Indicator: A qualitative Objective (the “Where do we want to go?”) paired with 3–5 quantitative Key Results(the “How do we know we’re getting there?”).
- Strategic Impact: Creates radical transparency and alignment, ensuring that every team’s “bottom-up” effort is directly fueling the “top-down” strategy.
Project to Product
Definition: Project to Product is a strategic organisational shift from managing software delivery as a series of time-bound “projects” to managing it as a set of long-lived, outcome-oriented “products.” Popularised by Dr. Mik Kersten via the Flow Framework, it focuses on aligning technology investment with business value streams.
- Origin: Popularised by Dr. Mik Kersten via the Flow Framework and the book Project to Product.
- Key Indicator: Moving away from “annual planning” toward continuous funding based on Flow Metrics.
- Strategic Impact: Enables organisations to see the “black box” of IT delivery, reducing time-to-market by focusing on flow efficiency rather than just resource utilisation.
Strategy Execution Gap
Strategic Flow defines the Strategy Execution Gap as the common failure point where high-level strategic plans fail to translate into daily activities and measurable results.
Strategy Map
Definition: A Strategy Map is a visual tool (often part of a Balanced Scorecard) that shows the cause-and-effect relationships between strategic objectives.
- Origin: Kaplan and Norton (later refinement of the BSC).
- Key Indicator: A vertical diagram showing how “Learning” leads to better “Processes,” which leads to “Customer Value,” which finally leads to “Financial Success.”
- Strategic Impact: Makes the strategy “narrative” clear to every employee, moving beyond abstract goals to a visible path of execution.
Systems Picture
Definition: A Systems Picture is a graphic that maps out how the different teams, workflows, and processes within the organisation inter-relate as a system, not just separate entities within an ecosystem. Crucially, it highlights points of friction and bottlenecks. It is created during a period of Discovery and used to inform constructive discussion with clients, forming the basis of co-creation of a plan to increase organisational alignment and close the gap between strategic intention and execution.
Systems pictures are often created at a point where execution feels stalled and messy, meaning they will reflect that feeling of messiness. This is a natural part of the process. As an engagement progresses, the Systems Picture should be updated to reflect changes made to the organisation. Over time, you should see the picture reflect a more deliberate organisational design.
Theory of Constraints
Definition: The Theory of Constraints is a management methodology which states that every complex system has at least one limiting factor, known as a constraint or bottleneck, that restricts its overall output.
- Origin: Dr. Eliyahu M. Goldratt.
- Key Indicators: The Theory of Constraints (TOC) relies on three primary financial indicators, collectively known as Throughput Accounting, to measure and control system performance.
- Strategic Impact: Traditional strategies look to optimise every department locally (which usually results in higher costs and excess inventory). TOC forces organisations to treat the primary constraint as the synchronisation engine for the entire business. By designing the organisation around the bottleneck, firms drastically reduce delivery lead times and increase On-Time-In-Full (OTIF) delivery metrics simultaneously. Because TOC dictates that building inventory without immediate sales is a strategic liability, implementing it drops work-in-progress / process (WIP) levels, freeing up cash flow almost immediately. It also strips away the noise of complex cost-accounting matrices. Leaders evaluate strategic moves based on a straightforward framework: Does this action increase Throughput, or does it reduce Inventory and Operating Expense?
Throughput
Definition: The number of work items finished per unit of time (e.g., per week). Essential for capacity planning.
Value Stream
Definition: The sequence of activities required to design, produce, and deliver a product or service to a customer. Mapping Values Streams is a precursor to continuous improvement. They may exist at different levels within the organisation from an entire line of business to a value stream for one specific service within a line of business.
Vanity Metrics (F4P Context)
Definition: Vanity metrics are data points that look impressive – such as social media “likes” or raw page views – but do not correlate to real business success or customer “purpose.”
- Origin: Popularised by Eric Ries in The Lean Startup.
- Key Indicator: Metrics that go up without a corresponding increase in revenue, retention, or customer satisfaction.
- Strategic Impact: Dangerously misleading; they create a false sense of progress that masks underlying strategic rot.
Wardley Mapping
Definition: A Wardley Map is a map for business strategy. It positions components of a value chain on an evolution axis (Genesis to Commodity), allowing for a visual representation of the competitive landscape.
- Origin: Created by Simon Wardley (2005).
- Key Indicator: An X-axis representing Evolution and a Y-axis representing Visibility to the user.
- Strategic Impact: Exposes hidden assumptions in a strategy and identifies “climatic patterns” (market forces) that can be exploited for a competitive advantage.
FAQ
Misalignment often stems from different departments using different definitions for success. A unified glossary ensures that “value” and “flow” mean the same thing to a Chief Product Officer as they do to a Lead Developer.
No. Strategic Flow is about selecting the right tool for the right context at the right time. Most organisations start with one (like OKRs) and integrate others (like Wardley Mapping) as their maturity grows.
Confused by how these fit together? Book a Strategic Execution Diagnostic to see the gap in your organisation.